Welcome to My
Project Gallery
Motor Activities Matching based on DTW
Spetember 2019 -
August 2020
This project is my main project during my time in University of Rochester. You can check the details of the project, including a PPT and a report, which are from my successor (Start in September 2020), Yuxuan He (何宇轩).
Its purpose is to use sensors to identify the types and repetition times of rehabilitation training for stroke patients.
The sensors we used is called MC-10 Sensors, it is light-weighted and can be affixed to human body. It contains accelerometer and gyroscope which can help us record motor signals for data analysis. Time scale is Unix microsecond timestamp, contains acceleration signals in 3 axis (in g) and gyroscope signals in 3 axis(in dps).
The following figure is an example of the right-bicep sensor data.
In order to classify and count the amount of different kinds of exercise, The whole process of data processing is as follows.
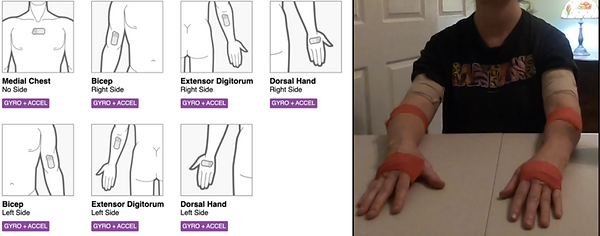
First we need to collect data from our patients. Each patient should wear 7 sensors on their left/right bicep, extensor digitorum, dorsal hand and medial chest. At the same time, we also record their exercising videos.
Data preprocessing including re-organization and resampling. Re-organization means we will store the signals data into array format to improve computational speed. Resampling means we should make sure the starting point and end points for all of signals in all 7 sensors should be the same and their data point intervals also should be the same by Lerp.(Original sampling rate is 31.25 HZ, we can change it into 10 HZ or other number).
We also need to get gravity signals from acceleration signals by applying an averaging sliding window. Because gravity direction contains important information of limb gestures. The following figure shows an example of what is gravity signal.
After that, we will try to segment signals in order to get exercise template for exercise repetition time counting.
Before signals segmentation, we need to synchronize sensors data with labeled videos. Remember, we also record videos when patients do exercises. The patients will be asked to pat the sensor on their chest and then finish different kinds of exercise. Then, we will use Adobe Premiere Pro to label the videos, including pat frame, start points and end points of each exercise repetition. Then we can export a csv file contains these labels.
Now, we can finish the synchronization between labelled video and signals. The strategy is called Tap-based Synchronization. We can match the pat frame with the acceleration peak in the chest sensor, then based on the FPS of the video, we will find the relations of labels and their time stamp.
After that, we can cut off exercise repetitions from the whole signals. Each repetition signals is 49 dimensions(7 sensors x (3 acc + 3 gyro +1 magnitude)). For each kind of exercise, we firstly align repetitions into the same length by DTW (Check the document). Then we take average of them to get template for each kind of exercise.
After we get the template, we can try to find the matching part from original signals. This is a time consuming part because we should use a bunch of sliding windows at the same time(0.8-1.2 template length) to try to find the matching part by applying DTW. After that, we will get a plot of DTW distance between original signals and template as you can see below. Then if we want to count the repetition number, we can just set a proper thresh and count the number of peaks.